
The essay
So the Quarterly Letter Showed Up…
If you're an LP, it feels good to open a quarterly letter and see 2.1x on the first page. Most LPs say they underwrite the manager and not the marks, and I believe them. But that number sticks, so it's worth looking at what's behind it first.
So what is TVPI, and why does it matter? Simply put, TVPI (total value to paid-in) is distributions plus current NAV, divided by the money you've paid in. Distributions are cash you already have. NAV is the GP's estimate of what the remaining companies are worth, and it's made up of individual marks. Each mark is someone deciding what a private company is worth this quarter. Sometimes that's a new investor who just paid that price. Sometimes it's the GP. Before I decide whether 2.1x is good, I want to know who set each mark.
Where Marks Come From
Most venture GPs follow fair value guidance, and in practice they hold each company at its last priced round unless something forces a change. That's reasonable. It also means a mark is only as good as the round behind it. Roughly from most reliable to least:
Recent outside-led priced rounds. A new investor with no existing stake did diligence and invested at that price in the last 12 to 18 months. Short of an exit, this is the best mark you'll get.
Insider-led rounds. Existing investors set the price on their own position. Sometimes that's fine. Sometimes it's a bridge at a small step-up that mostly exists to avoid a down round.
Held at cost for 18+ months. This looks conservative. Often it just means nobody has tested the price in a year and a half.
SAFEs and notes at the cap. A cap is a ceiling on the conversion price. Nobody has actually bought equity at that price yet.
Write-downs. Usually the most honest marks in the portfolio, since nobody marks a company down unless they have to.
Structure matters too. A round with a 2x liquidation preference or heavy participation, marked at the headline price, overstates what the common stock and the earlier preferred are worth. Some GPs adjust for that. Many don't, or don't say whether they do.
The Math Nobody Shows You
Take an illustrative $100M fund with $80M paid in, no distributions yet, and a NAV of $168M. Reported TVPI is 2.1x. Now sort the NAV by where each mark came from:
-
Recent outside-led priced rounds: $20M of cost, marked at $70M
-
Insider-led rounds: $15M of cost, marked at $45M
-
Held at cost 18+ months: $30M of cost, still at $30M
-
SAFEs and notes at the cap: $10M of cost, marked at $23M
-
Written down: $5M of cost, marked at zero
Now take the strict view. Keep the outside-led marks, put everything else back at cost, and leave the write-downs at zero.
Where you land:
-
Reported: NAV of $168M, TVPI of 2.1x
-
Strict: NAV of $125M, TVPI of about 1.6x
Same fund, same companies, same quarter. Neither number is the full truth. The 2.1x isn't wrong, and the 1.6x isn't some secret real answer. What matters is the gap between them. In this fund, about half of the $88M unrealized gain depends on insider pricing and SAFE caps. Put those five buckets in one stacked bar next to the two TVPIs and you'll learn more than from the rest of the letter.
What I'd Actually Ask
Ask for NAV by mark source. That's the breakdown above. A GP who knows their portfolio well will have it, or can put it together in a day.
Ask which marks came from rounds the GP led or co-led. Then ask what happened at the next outside round for those companies. This is usually where you learn the most.
Ask how much of NAV hasn't seen a priced round in 18 months. Then ask how they think about those companies today, not on the day the last round closed.
Ask how they mark structured rounds. Have them walk you through one real example with the actual terms.
Look at the quarter-over-quarter changes. A mark that only goes up, with no outside rounds behind it, is worth a phone call.
None of these are gotcha questions. A GP who has thought carefully about the portfolio is usually glad someone asked. Pay attention to how specific the answer is. If you get real numbers, that's a good sign. If you get a speech about "our conservative valuation policy," write that down too.
Final Thoughts
You're still underwriting the manager. You just get to do it with better information. A fund at 1.8x where most of the NAV comes from recent outside-led rounds can be a better bet than a fund at 2.4x built on insider bridges and SAFE caps. Recompute every fund the strict way and look at the gap before you look at the headline.
The chart
Nearly a decade in, median 2017 DPI is still 0.37x
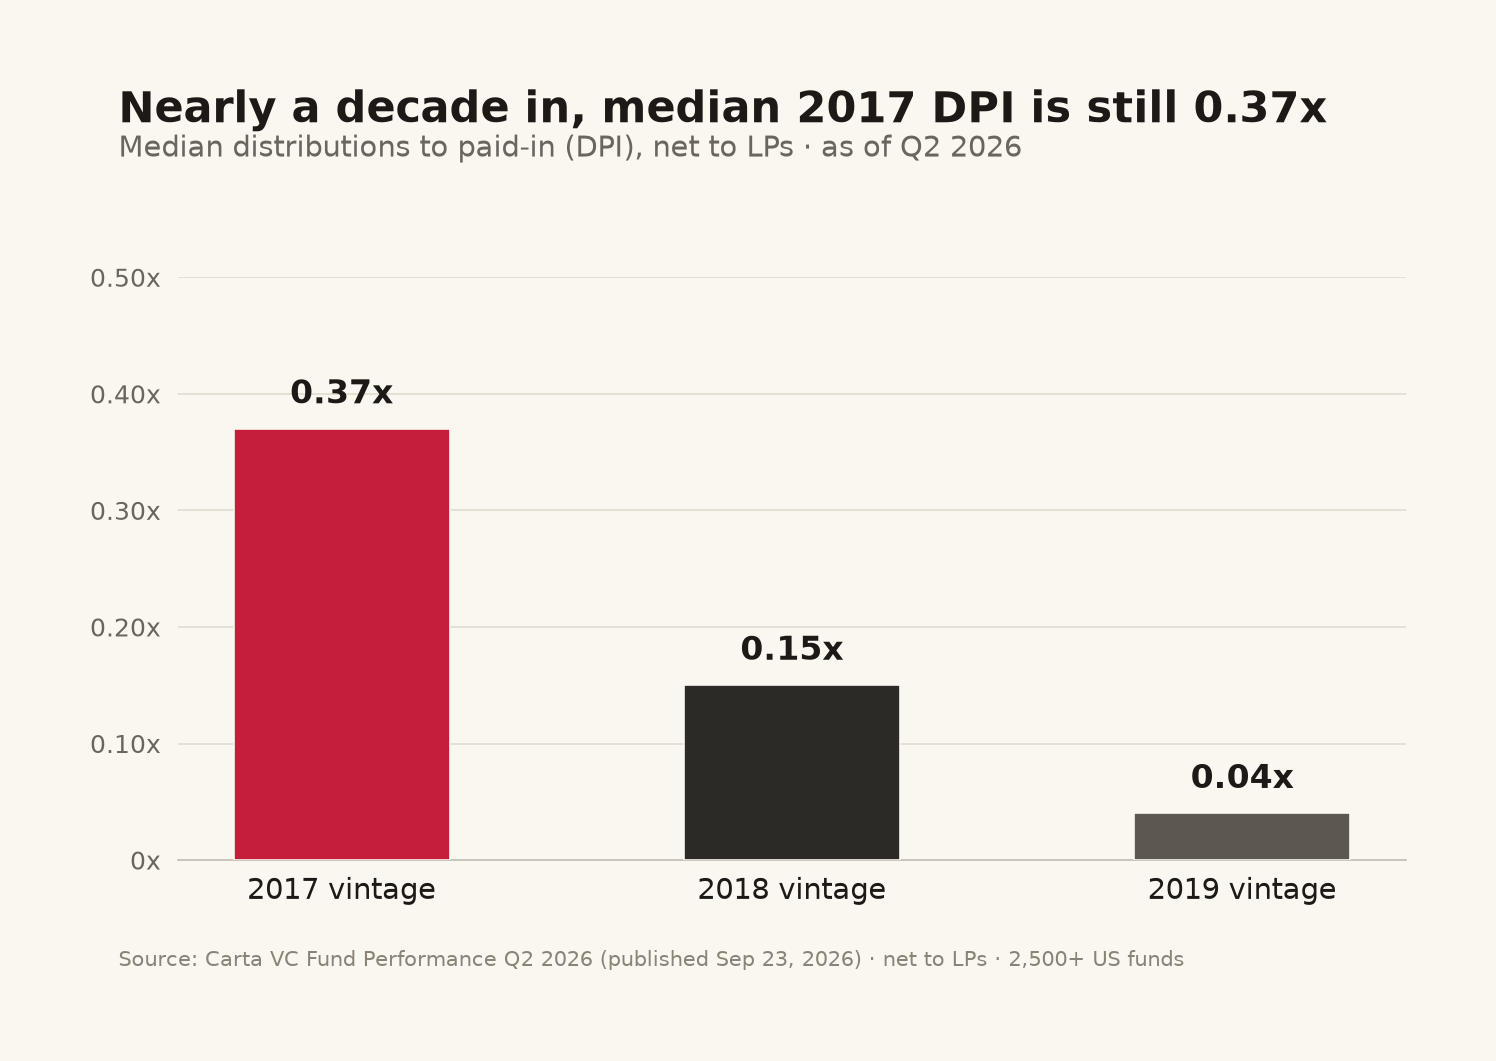
Carta's Q2 2026 fund book is the cleanest recent look at cash vs. marks. Median DPI — actual distributions back to LPs — sits at 0.37x for 2017 vintages, 0.15x for 2018, and 0.04x for 2019. These funds are approaching a decade since inception. Concrete returns for the typical fund are still hard to find.
Meanwhile top-decile TVPI for 2017 is 4.14x (up from 3.31x two years prior). TVPI is climbing. DPI is not keeping up. Most of the "return" an LP sees on a statement is still a mark — often a last-round price nobody stress-tested against an exit.
Implication: when a GP says the fund is "2x," ask how much of that is DPI. Marks are a claim. Distributions are a fact.
Source: Carta VC Fund Performance Q2 2026 (published Sep 23, 2026; net to LPs).
The tactic
Recompute TVPI by mark source
Ask every GP for NAV broken out by who set each mark: outside-led round, insider-led round, held at cost, SAFE or note at the cap, written down.
Recompute TVPI counting only marks set by a new outside lead in the last 18 months, with everything else at cost and write-downs at zero.
Look at the gap between the two numbers before you look at the headline.
Failure this prevents: Prevents re-upping on a 2.4x fund whose gain is mostly insider bridges and SAFE caps.
The rethink
Used to: Positions held at cost for a long time were the safe, conservative part of a portfolio.
Now: Long-held at-cost marks are the part of NAV with the least information. Nobody has tested the price, up or down, in 18 months or more.
What moved: Following long-held at-cost positions across several funds until they finally saw a priced round or an exit. More of them repriced down than up, and only a few came out right at cost. I'd change my mind if exit data showed long-held at-cost positions return cost or better at a normal rate.
Views are my own, not Alumni Ventures'. Nothing here is investment advice. Deals and companies are anonymized unless already public.